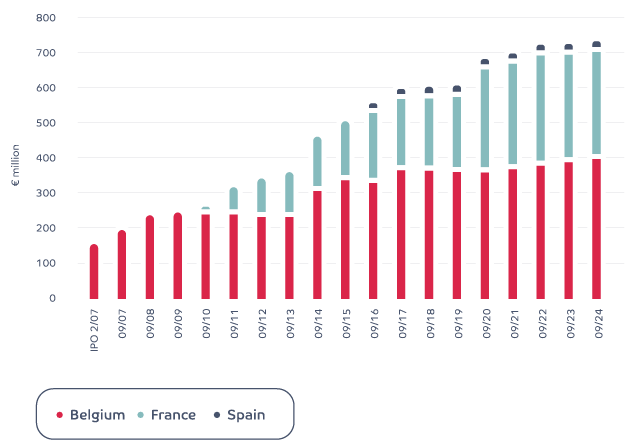
Our portfolio is composed of retail properties on the outskirts of urban areas in Belgium, France and Spain, characterised by a predominance of the food sector.
Portfolio growth
| Consolidated results (€000s) | 30/09/2024 | 30/09/2023 |
|---|---|---|
| Rental income | 53,345 | 51,322 |
| Rental related charges | -223 | -223 |
| Recovery of property charges | 766 | 956 |
| Rental related charges and taxes not recovered | -308 | -312 |
| Other revenue and rental related charges | -15 | -26 |
| Property Result | 53,656 | 51,716 |
| Property charges | -4,835 | -4,633 |
| Corporate overheads | -5,196 | -4,657 |
| Other operating income and charges | 0 | 1 |
| Operating result before result on portfolio | 43,534 | 42,427 |
| Operating margin | 81.6% | 82.7% |
| Financial income | 309 | 765 |
| Net interest charges | -6,477 | -6,157 |
| Other financial charges | -816 | -685 |
| Taxes | -364 | -342 |
| EPRA Earnings | 36,185 | 36,009 |
| Result on sales of investment properties | 1 | 0 |
| Change in the fair value of investment properties | 5,963 | -745 |
| Portfolio Results | 5,964 | -745 |
| Change in fair value of financial assets and liabilities | -16,395 | -1,543 |
| Deffered tax | -238 | 85 |
| NET RESULT | 25,517 | 33,806 |
| EPRA Earnings per share (€) | 5.49 | 5.46 |
| Net result per share (€) | 3.87 | 5.13 |
| Number of shares | 6,595,985 | 6,595,985 |
| Consolidated balance sheet (€000s) | 30/09/2024 | 30/09/2023 |
|---|---|---|
| Assets | 780,658 | 786,469 |
| Intangible assets | 375 | 236 |
| Investment properties | 748,621 | 740,856 |
| Other tangible assets | 963 | 49 |
| Other non-current assets | 16,145 | 30,670 |
| Assets held for sale | 259 | 0 |
| Current financial assets | 926 | 867 |
| Trade receivables | 6,120 | 5,556 |
| Cash and cash equivalents | 3,070 | 5,423 |
| Other current assets | 4,179 | 2,811 |
| Equity and liabilities | 780,658 | 786,469 |
| Equity | 442,921 | 444,763 |
| Non-current financial debts | 196,391 | 262,670 |
| Other non-current liabilities | 5,060 | 2,806 |
| Deferred taxes liabilities | 6,516 | 6,085 |
| Current financial debts | 115,280 | 57,829 |
| Other current liabilities | 14,491 | 12,316 |
| IFRS NAV (€/share) | 67.15 | 67.43 |
| EPRA NTA (€/share) | 65.80 | 63.59 |
| Debt ratio (in accordance with the Royal Decree) | 42.8% | 44.0% |
| EPRA LTV | 42.1% | 43.4% |
| Consolidated result per share (EUROS) | 30/09/2024 | 30/09/2023 |
|---|---|---|
| EPRA earnings | 5.49 | 5.46 |
| Net result per share | 3.87 | 5.13 |